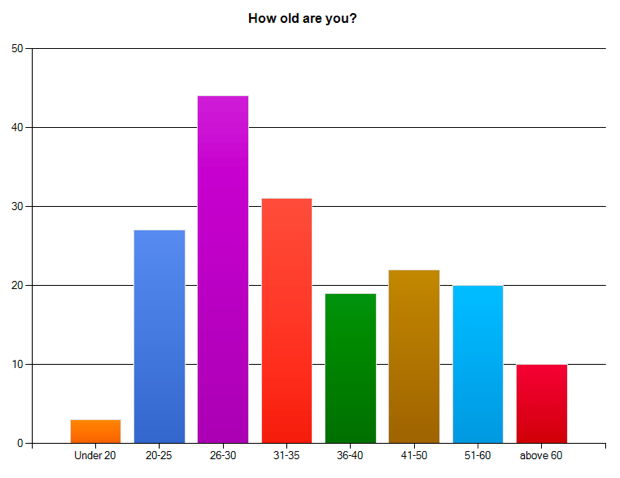
Thank you to all who filled out the Women in the Academy & Professions survey at The Well! Of the approximately 650 subscribers in the fall of 2010, 179 people took the survey.
Demographic/Personal Information
Gender:
90% Women
10% Men
Our readers as reflected by the survey are overwhelmingly women — no surprise. We were actually surprised and pleased that ten percent of survey respondents were men. Although our target audience is women, the majority of our content is relevant and applicable to the lives of both women and men.
Age:
2% Under 20
15% 20-25
25% 26-30
18% 31-35
11% 36-40
12% 41-50
11% 51-60
6% over 60
The largest contingent age-wise was between the ages of 26 and 30 (25%) and the majority of respondents (58%) were between the ages of 20 and 35. The data for readers in the older age group is a bit misleading as the age spread changes from five year intervals to ten year intervals.
Ethnicity:
12% Asian/South Asian
6% Black/African-American
7% Hispanic/Latino
1% Middle Eastern
2% Native American/Alaskan Native/First Nations
77% White
3% Other
These numbers do add up to greater than 100% as respondents were instructed to check “all that apply.” It seems our audience is more diverse in the under-thirty age group, with a third identifying an ethnic identity other than white. Of those over 30 years old, 84% identified as white, in those aged 30 and under, 67% identified as white.
Highest Educational Level Completed:
24% Bachelor’s Degree
36% Master’s degree,
27% PhD 6% Professional degree
83% Have or are pursuing advanced degrees

69% of our respondents have advanced degrees. Of the 24% identifying themselves with a Bachelor’s degree as the highest degree completed, 62% are currently in graduate or professional school pursuing advanced degrees for a total of 83% of respondents having or pursuing advanced degrees.
Student Status:
Just under 40% of our respondents are currently students.
Academic Discipline represented:
8% Arts
4% Engineering and Technology
32% Humanities
13% Natural Sciences
17% Professions
20% Social Sciences 6% Other
The following more specifically identified fields are represented by three or more respondents:
Biology
Communications
Creative writing
English language and literature
History
Law
Library science
Mathematics
Music
Music history
Nursing
Philosophy
Psychology
Religion and theology
Religious studies
Social work
Speech/language pathology
Theology
The tool we used was rather confusing and ambiguous, including separate listings for “religion and theology,” “religious studies,” and “theology.” We apologize, but are thankful for your responses and see a wide variety of disciplines represented.
Employment Status:
54% Work full-time
17% Work half-time or more
10% Work less than half-time
12% Unemployed.
Position in Academic Setting:
53 individuals or 30% of all respondents identified themselves as faculty members in some capacity including tenured faculty, those in tenure-track positions, limited term employees, and adjuncts.
We missed offering the category of teaching and research assistants and apologize! Eight respondents identified themselves in the “other” category as TAs and RAs. Also represented were administrative staff, administrators, technical staff, and campus ministry staff.
Of those employed in academic settings, the nature of the school is:
53% Research institution
15% Liberal arts secular institutions
25% Religiously-affiliated schools
4% Community college setting
Occupational areas for those in non-academic settings:
2% Arts
6% Computers/IT
9% Education
2% Framing/Horticulture
4% Food Service
15% Healthcare
4% Law
6% Management
19% Ministry
4% Office/Admin
6% Physical Sciences
2% Sales
17% Social Services
6% Writing
53 individuals responding to being employed in a non-academic setting. Occupational areas were noted as above although the many comments (26) identifying other or more specific occupational areas indicates the choice of responses offered was not completely satisfying.
Marital Status:
42% Single
53% Married
4% Divorced
1% Widowed
60% of the 26 to 30 year old respondents are single and 44% between the ages of 31 and 35 are single. 32% of our single respondents are aged 31 years and older.
How many children:
56% none
11% 1 child
10% 2 children
8% 3 children
3% 4 children
2% 4 children or more
Residence:
Our survey respondents are primarily from the United States and include respondents from 37 states, the District of Columbia, and Puerto Rico.
Countries besides the United States represented are:
Canada
The Dominican Republic
Kenya
The Philippines
South Africa
Sweden
Religious affiliation:
98% Protestant
2% Catholic
1% Nothing in particular.
Several comments were made indicating some respondents were uncomfortable with any label besides a more general designation as “Christian” or “Christ-follower.”
Feedback on content and what can we do for you
The sections of the survey titled “Feedback on content at The Well” and “What can Women in the Academy & Professions do for you?” have provided us with a host of comments that have been very helpful as we continue to develop this ministry. We continue to refer to your comments for ideas, potential writers (from those of you who have indicated you are interested), and suggestions for how this ministry can be improved and how it can support you. A listing of articles that were especially helpful to respondents follows.
And, truthfully, we go back to the survey for the encouragement you have given us, as we read comments such as these:
- Thank you for The Well. Too many avenues for Christian women do not fit women like me (in academia or professional career) but The Well provides me the “right” place to stop and ponder.
- It’s a great resource for people who might often feel that they’re alone. There are few Christians in my field and the number of women is really low.
- It has enriched my sense of following God through my time in academia.
- It is a good source of encouragement to those seeking to live for God’s glory and pursue intellectual careers.
- This is a great resource, I am so glad I found you.
Thank you, all! We so appreciate the time you took to share your thoughts with us, and we welcome your continued responses.